Analyse the end-to-end performance of business processes.

Written by Shruti Patel
Through the Analytics Report, you can analyze the end-to-end performance of business processes, from sourcing to hiring, understand the data, and modify your marketing efforts for vacancies.
To view the Analytics Report, first go to the Reports Module from the left-hand menu option, click on the Other tab, and select Analytics Reports.

You can generate this report for a specific duration of your choice for a particular client and click on Run Report.
Select the Search Period first.

Now Select Client Name and then Run the Report by clicking on the Run Report Button.

After Clicking on the Run Report button the following screen will appear.

The report gathers the below details.
Note: For Top sourcing channels, Top hiring channels and Candidate by source the main sources included here are Upload, Created, Import from Mailbox, Web Site, FaceBook, LinkedIn, Twitter, Chrome Extension, Outlook Add-in, Gmail Add-in, Job boards, Self Service Portal, and API.
Top Sourcing Channel
The primary marketing channel through which the highest volume of applications is received. The subsequent list comprises the sources taken into account.

Top Hiring Channel
Marketing channel from which maximum hiring of candidates was done.

Offer Acceptance Ratio
The calculation involves determining the percentage of candidates who advanced to the offered stage and how many of them were ultimately hired for the job.
Offer Acceptance Ratio = Count of Hired Candidates / Count of Offered Candidates * 100

Interview to Offer Ratio
The calculation involves determining the percentage ratio of candidates who applied for an interview and the number who progressed to the offer stage.
Interview to Offer Ratio = Count of Offered Candidate / Count of Interviews * 100

Submit to Interview Ratio
The percentage ratio of candidates who reach the Interview stage after they are submitted to the client or hiring manager for review. The calculation is done as follows.
Submit to Interview Ratio = Count of Interview / Count of Submission * 100

Added to Hire Ratio
The percentage ratio of candidates who are assigned to the job by recruiters and got hired. The calculation is done as follows.
Added to Hire Ratio = Count of Hired Candidates / Counts of Assigned Candidates * 100

Added to Submitted Ratio
The percentage ratio of the number of submitted candidates to the client or hiring manager for review out of all which recruiters assign. The calculation is done as follows:
Added to Submitted Ratio = Count of Submission / Counts of Assigned Candidates * 100

Submitted to Hire Ratio
The percentage ratio of candidates hired after they are submitted to the client or hiring manager for review. The calculation is done as follows.
Submitted to Hired Ratio = Counts of Hired Candidates / Counts of Submission * 100

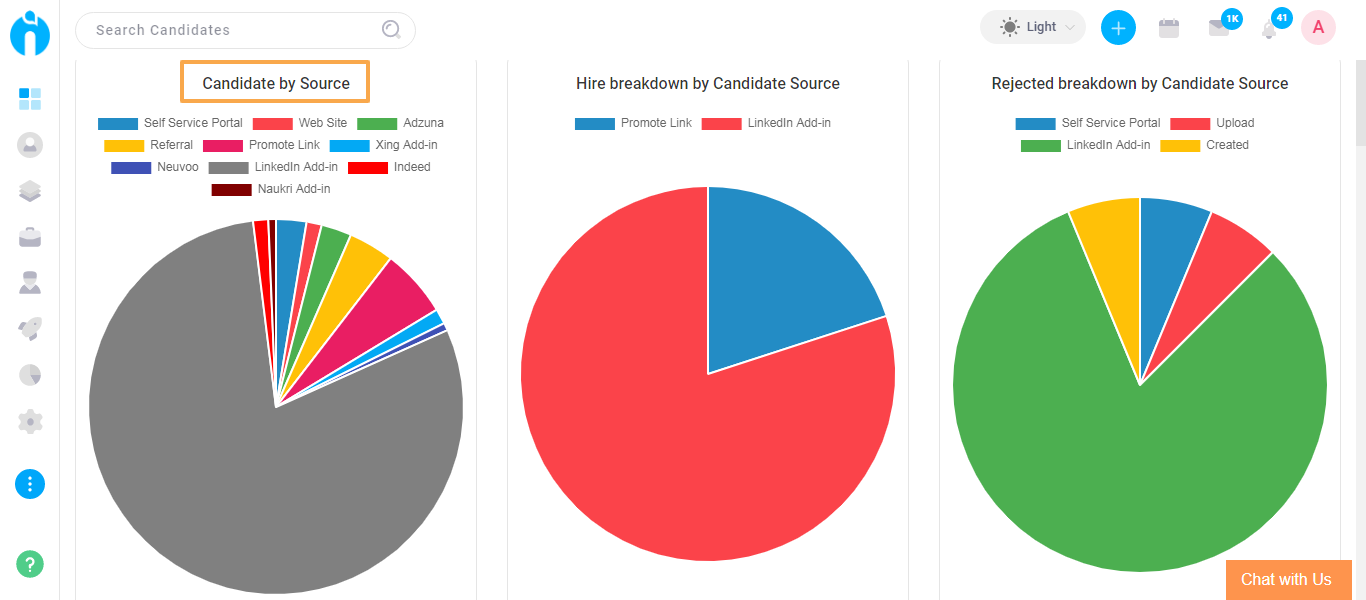
You can view the pie chart to get an understanding of the candidate breakdown as per their source.
Candidate by Source
The pie chart displays the count of candidates sourced from different recruitment marketing channels.
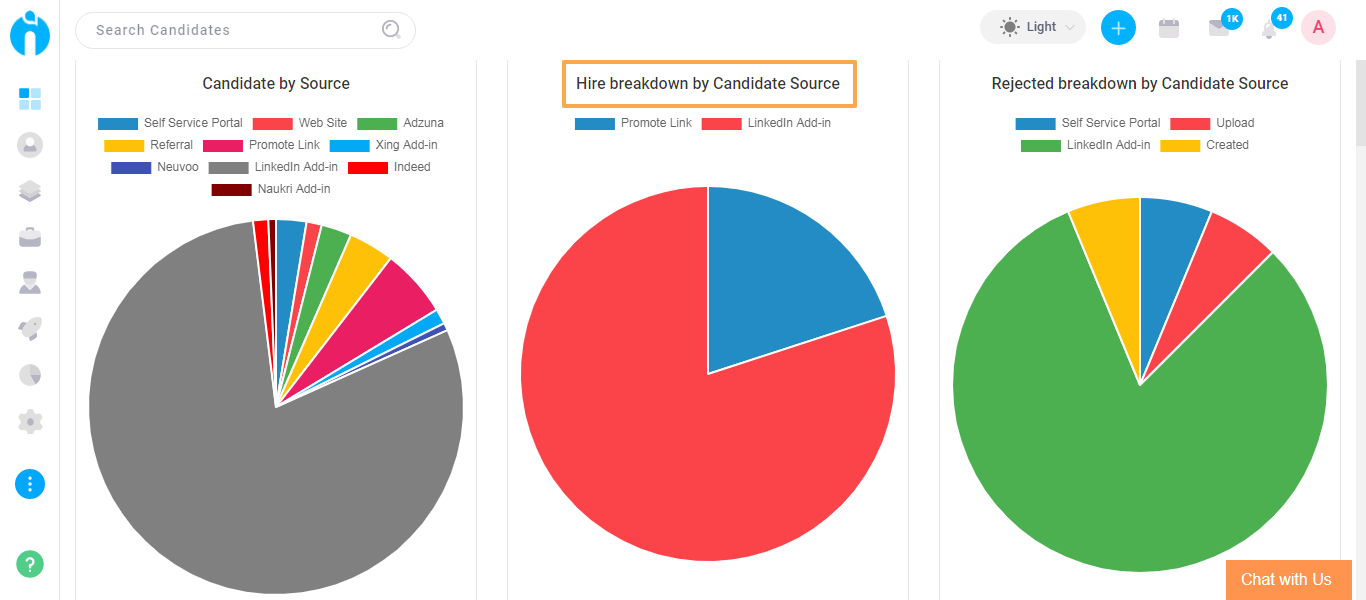
Hire BreakDown by Candidate Source
The pie chart displays the counts of candidates being hired from different sources. All the sources will be considered to calculate the values.
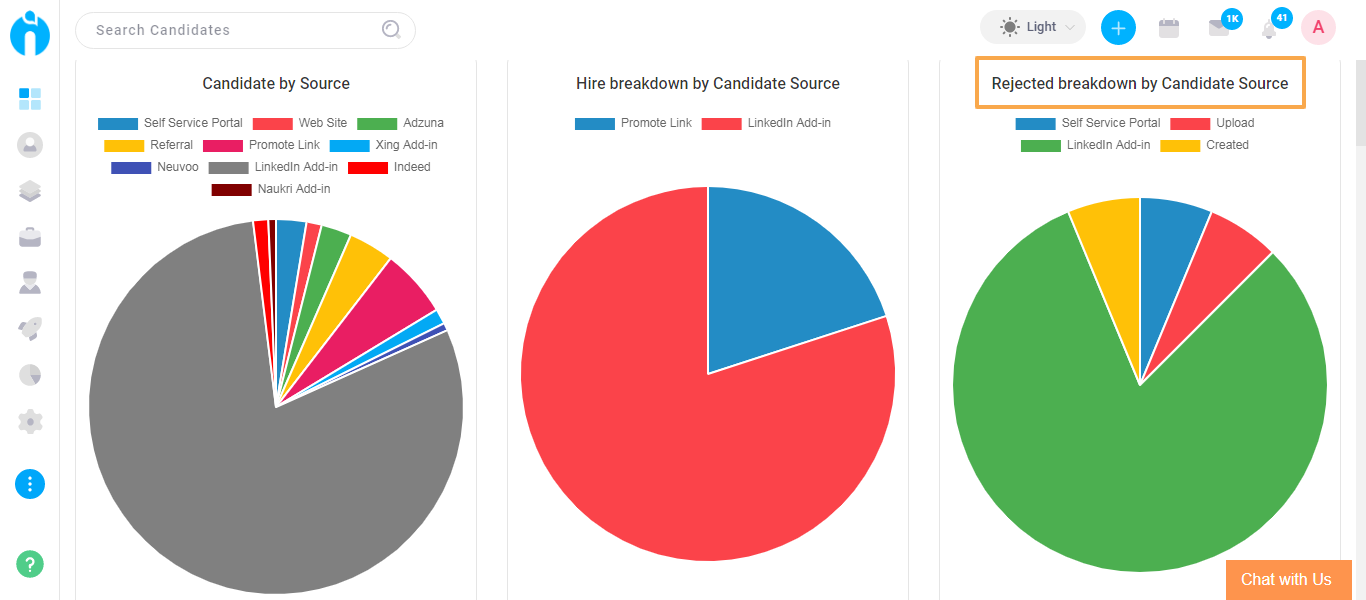
Rejected BreakDown by Candidate Source
The pie chart displays the counts of candidates being rejected from different marketing sources. All the sources will be considered to calculate the values.
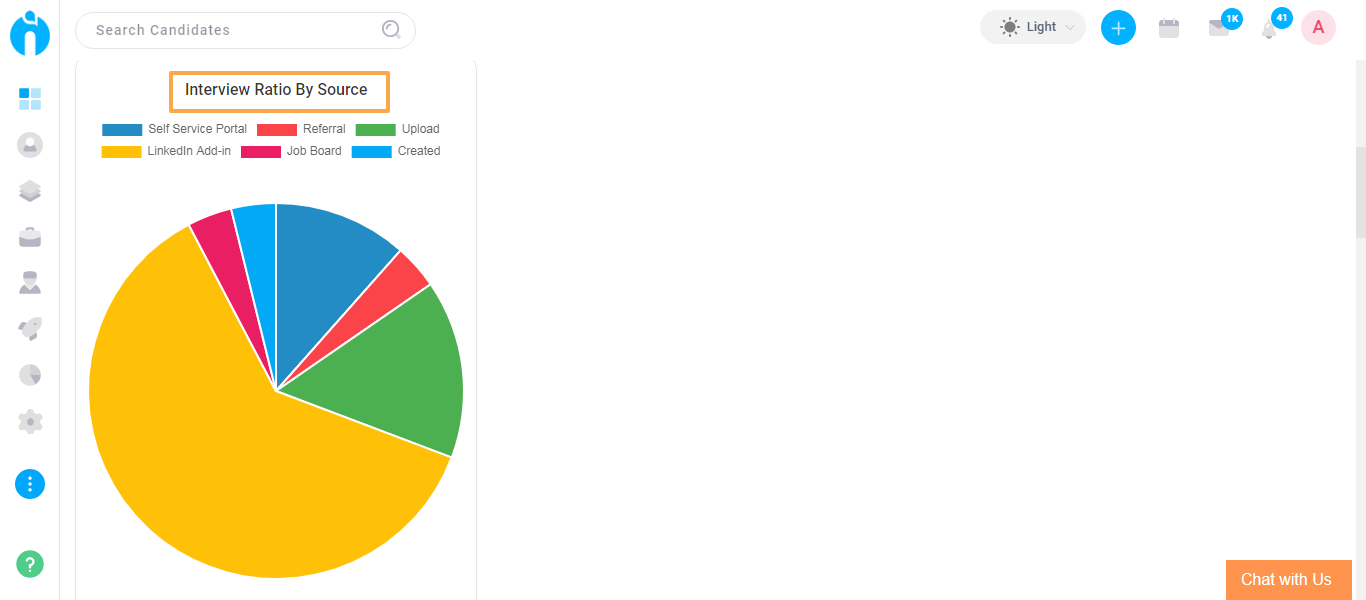
Interview Ratio by Candidate Source
The pie chart displays the candidates interviewed from different marketing sources. All the sources will be considered to calculate the values.
You can further analyse the data on the below parameters for strategic decisions.
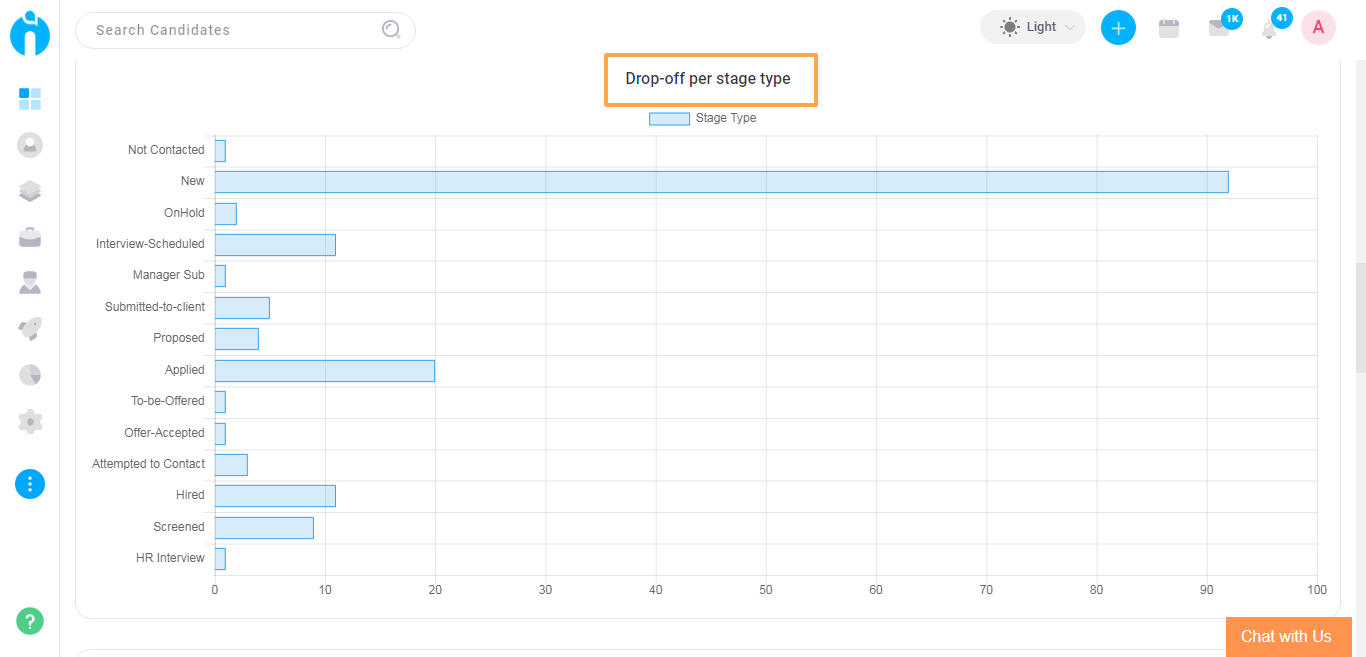
Drop-off per stage type
The horizontal bar chart represents the counts of candidates rejected from each stage of the recruitment process.
The Y-axis of the graph shows the candidate status and the X-axis of the graph shows the drop-off count per stage.
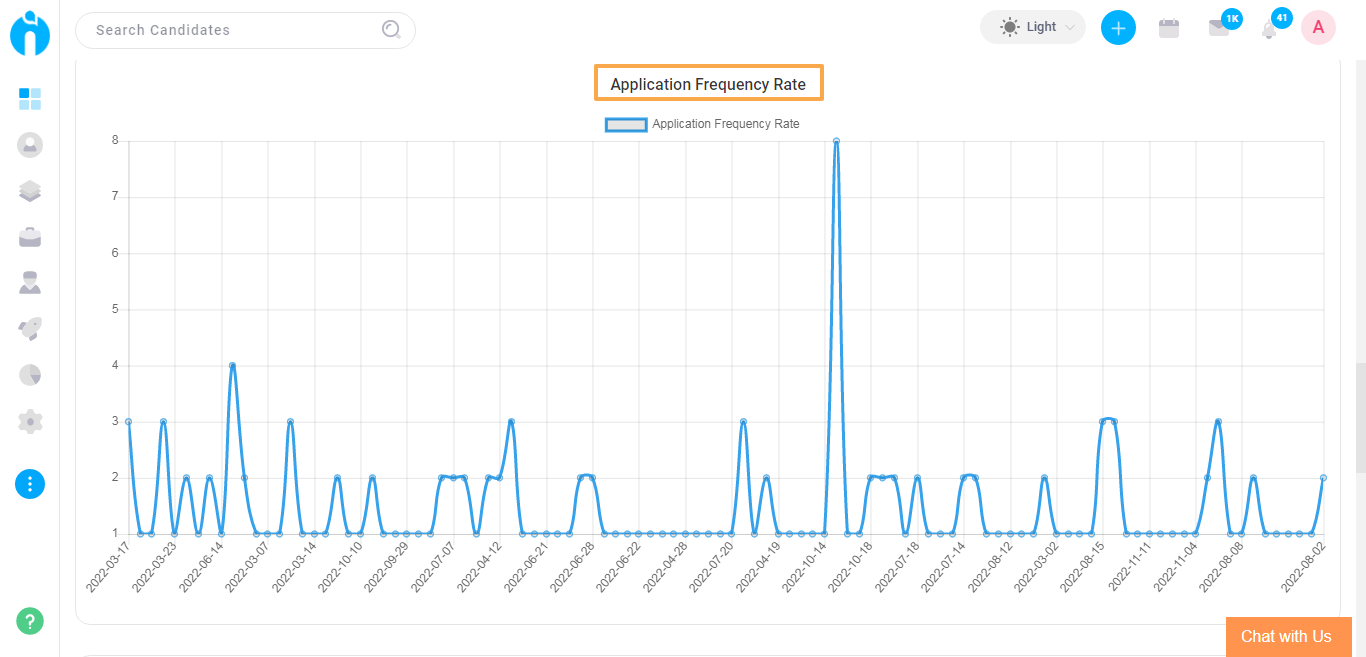
Application Frequency Rate
The line chart represents the counts of the number of applications received within the chosen duration.
The Y-axis of the graph shows the count of applications received and the X-axis of the graph shows the date of the application received.
The main sources included here are Upload, Created, Import from Mailbox, Web Site, FaceBook, LinkedIn, Twitter, Chrome Extension, Outlook Add-in, Gmail Add-in, Job boards, Self Service Portal, and API.
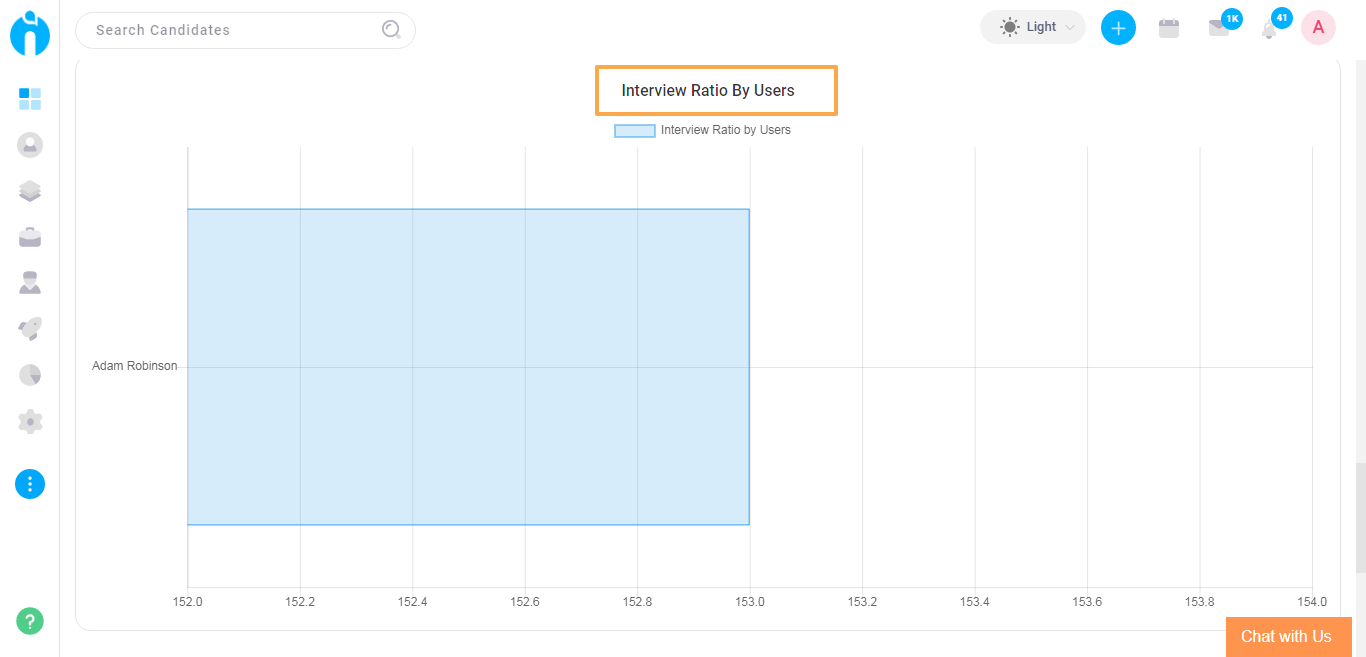
Interview Ratio by Users
The horizontal bar chart represents the ratio considering interviews scheduled out of candidates submitted to the hiring manager or clients by the system users. Here is the calculation performed for each user who worked for the selected duration.
Interview Ratio of User = Count of Interview / Count of Submission * 100
The Y-axis of the graph shows the name of the users and the X-axis of the graph shows the percentage of interviews.
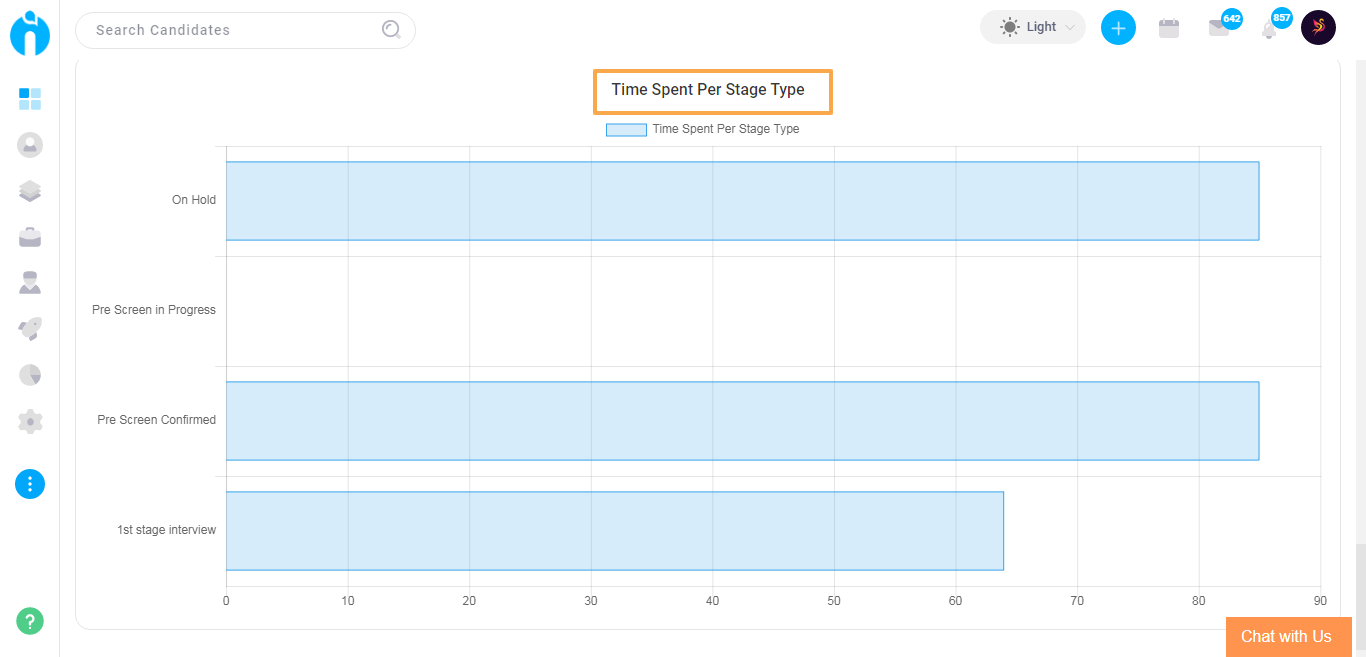
Time Spent Per Stage Type
The horizontal bar chart represents the ratio of time taken by the users to update the status of the candidate who was assigned to the job. The calculation is done as follows for each status:
Time Spent Per Stage Type = Total days the candidate remains in the Status / Count of Candidate Status Update.
The Y-axis of the graph shows the candidate's status and the X-axis of the graph shows the time spent on the status.